Live network map
The whole network stays fluid at every zoom, with live telemetry and events overlaid on the model — and every meter at a real addressed building.

Core platform · Analytics
GDEA joins the connectivity model from the utility’s GIS with live SCADA telemetry and the utility’s AMI meter data, and serves one operational picture of electric, gas and water networks — solved with real power-flow and hydraulic physics, with reliability, fault, capacity, interconnection and loss analytics on top.
Every asset
on one live map
3 Commodities
electricity · gas · water
Real physics
power flow & hydraulics
Monitoring-only
no command path to the field
The network eye
The connectivity model knows what each network is; SCADA and AMI know what is happening to it. GDEA joins them — permanently, at full scale, for electricity, gas, and water — then puts real solvers on top: power flow for every electric feeder, hydraulic analysis for gas and water. Every analysis falls out of that join: where the fault is, which regulator will fail on the next cold morning, which water district is leaking, and what building the next project would actually fix. And when a data-center-scale request lands on the interconnection queue, GDEA answers it end to end — from honest queue totals to the engineering at the point of connection.
See the network
The whole network stays fluid at every zoom, with live telemetry and events overlaid on the model — and every meter at a real addressed building.
Continuous checks on the imported GIS model — connectivity, phasing, and data gaps, found before they mislead an operator.
Tells a communications fault from a power outage, so silent meters that still have power do not send a line crew.
What a failure in one network does to plant in another — the de-energized feeder carrying a pump station — inferred, and labeled as such.
Electric reliability & capacity
SAIDI, SAIFI, CAIDI, MAIFI, and CEMI computed to IEEE 1366 from the utility’s own event history.
From measured fault current, and independently from which meters went dark — both shown on the map.
Feeder headroom with the binding constraint named, conservation voltage reduction analysis, and demand broken down by customer class.
Home EV charging found across every meter on the network with the Home Energy Management detector, and set beside the utility’s records: chargers the meters show that the records don’t, and the reverse. Reported, never rewritten.
Gas & water
Unaccounted-for gas and whether it is growing, regulator droop and lock-up, odorant intensity, line pack, and a graded leak register with due dates — plus a pipe inventory by material and vintage, methane emissions, and a design-day demand model that shows which main runs out of headroom first.
Night flow per district and whether leakage is getting worse, bursts, and pressure-reducing valve and pump station performance; reservoir residence, estimated water age and chlorine, and turbidity; peaking factors, tomorrow's demand, fire flow per district, and the pipes whose loss would hurt most.
Planning & investment
Reconductor a feeder, replace a main, re-set the city gate — base and scenario are compared side by side, so the difference is the change and nothing else. A refusal, with reasons, is a first-class answer.
The data-center queue as a register: likely duplicates flagged with honest gross and net totals, feasibility at every ramp step, and connection options compared on one scale.
Transformer thermal aging, plus a probability of failure for every asset.
Candidate projects ranked against the constraints the analytics actually found — what to build, and in what order.
Work & integration
The utility’s service orders shown beside what GDEA found: the work open on each asset, the findings that still need attention, and a request for work when one is needed — requested by GDEA, always dispatched by the utility.
A published API contract for every operation, kept in step with the product, with role-based access on each one — and AI assistants can connect to use the same operations.
How it works
Step 1
The connectivity model arrives from the utility’s GIS for every commodity, checked by continuous model-quality analysis.
Step 2
GDEA speaks DNP3 and IEC-104 to the SCADA estate, taking data one way: inward — and AMI reads and events arrive already validated from the Grid Data Management Platform.
Step 3
Telemetry is joined to the model as it arrives — kept as history, and shown live on the map.
Step 4
Power flow runs for every electric feeder and hydraulic analysis for gas and water — and the scenario sandbox answers every what-if the same way.
Step 5
The same joined picture powers the control room, the planner, the reliability engineer, and the executive dashboard.
Screens from a synthetic utility. Names and figures are illustrative.
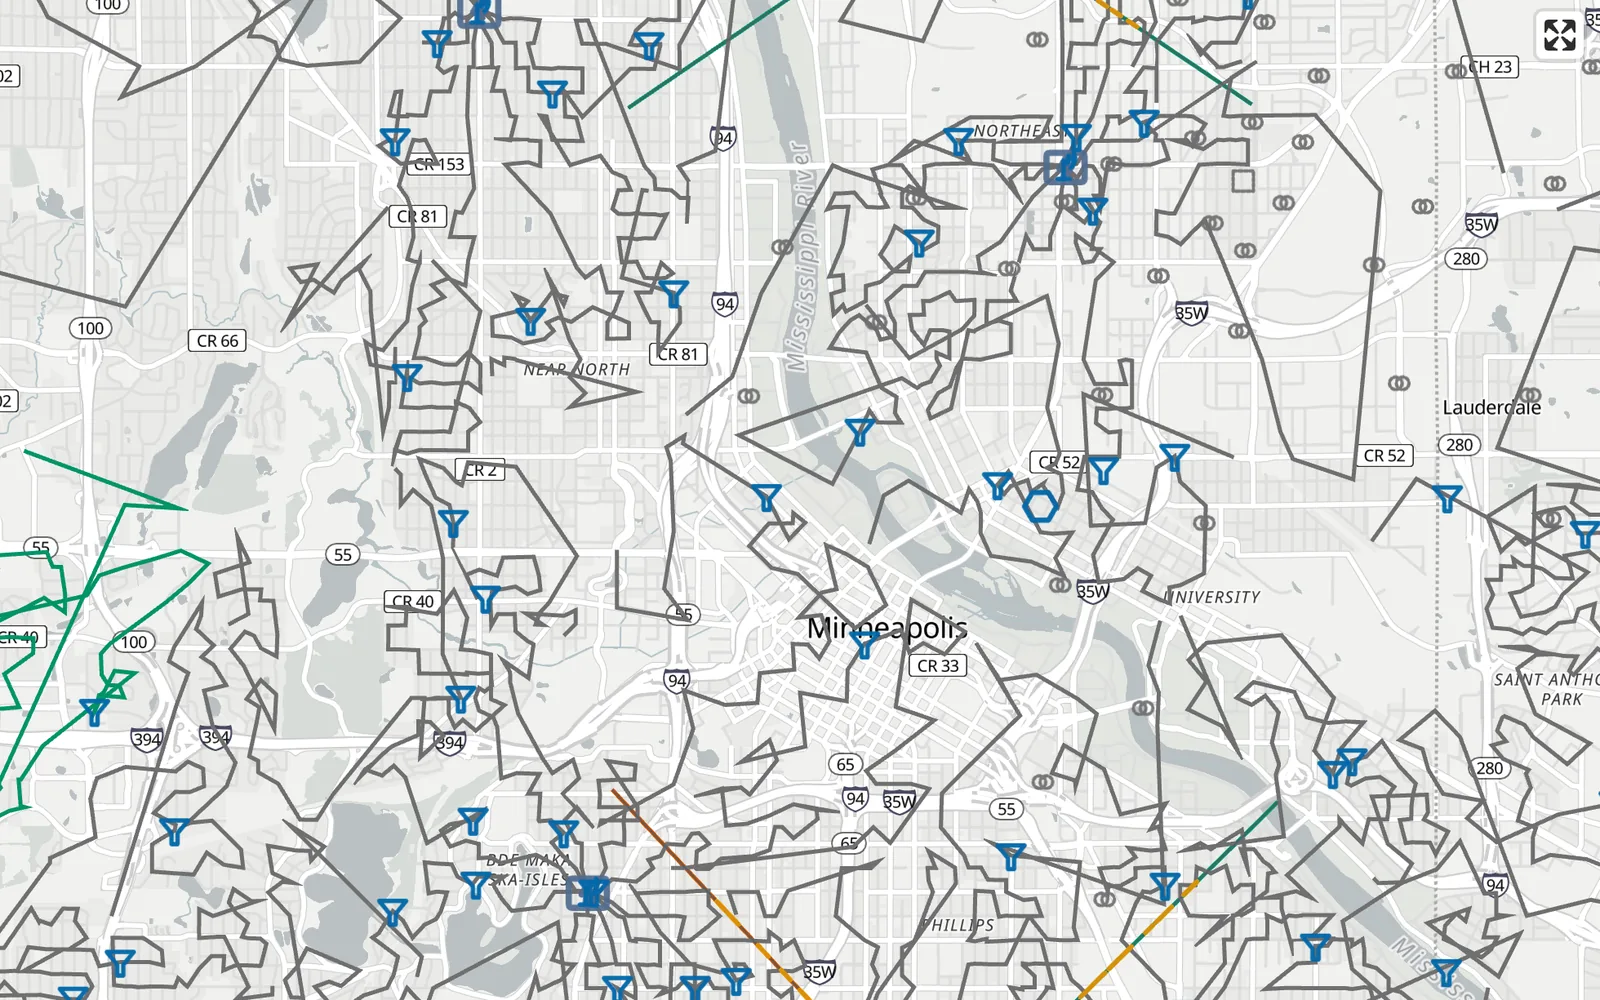
The live network map. The connectivity model with live telemetry and events on top, at every zoom.
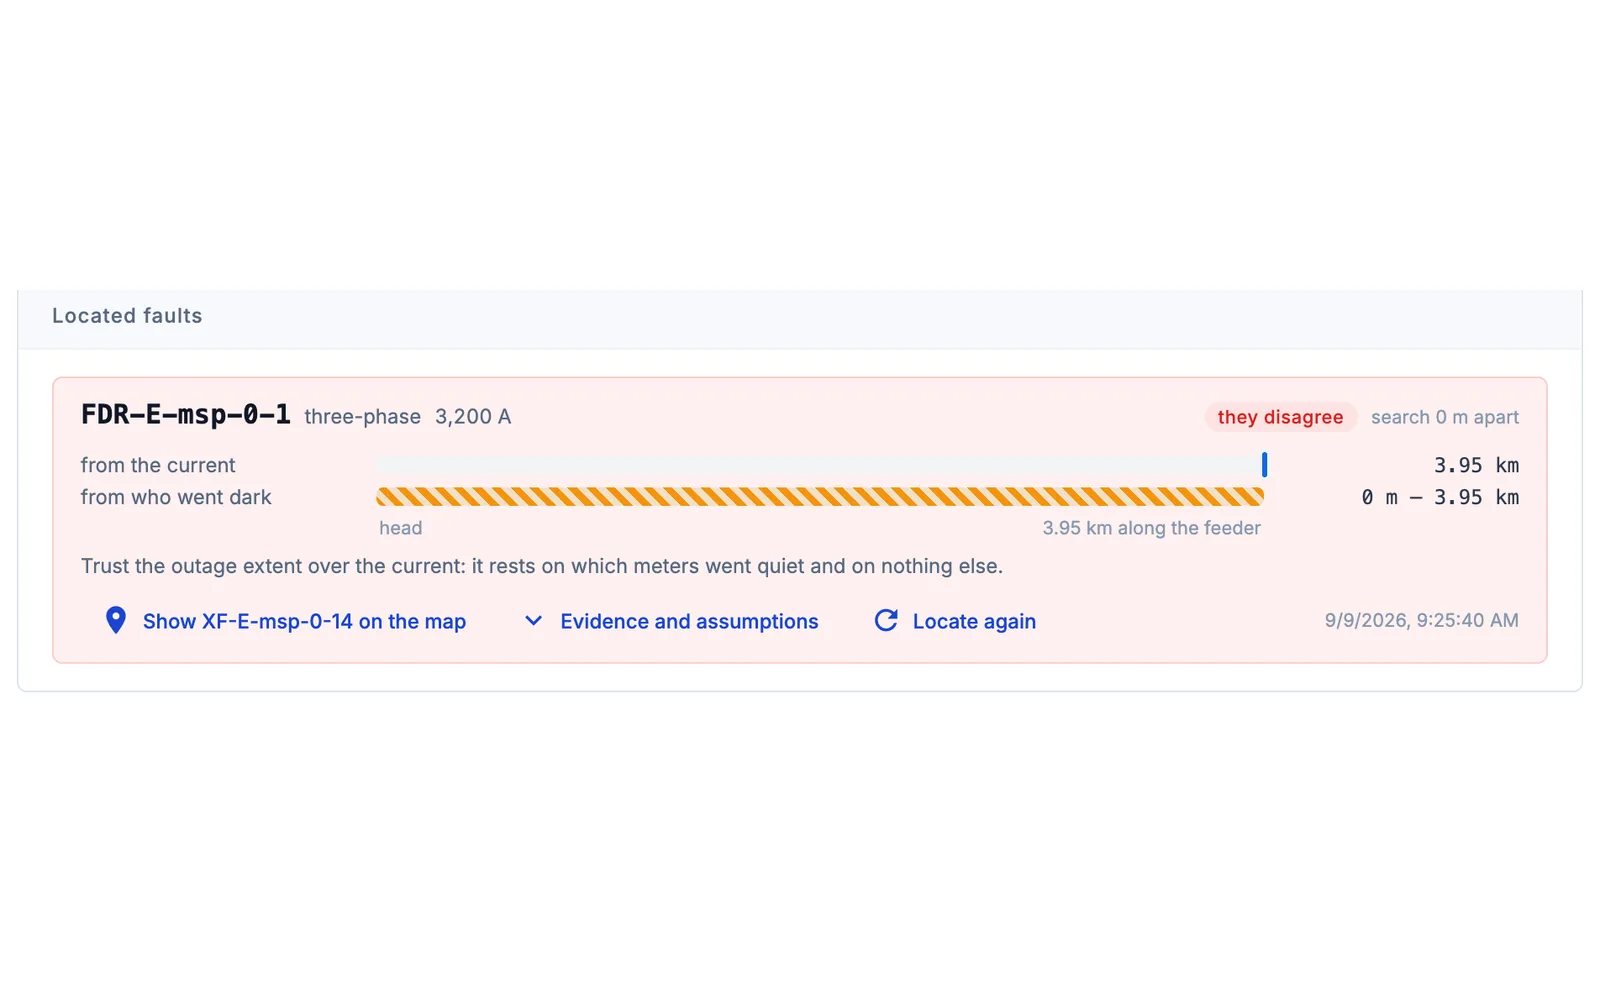
A located fault, two ways. From the fault current and from the meters that went dark — and whether they agree.
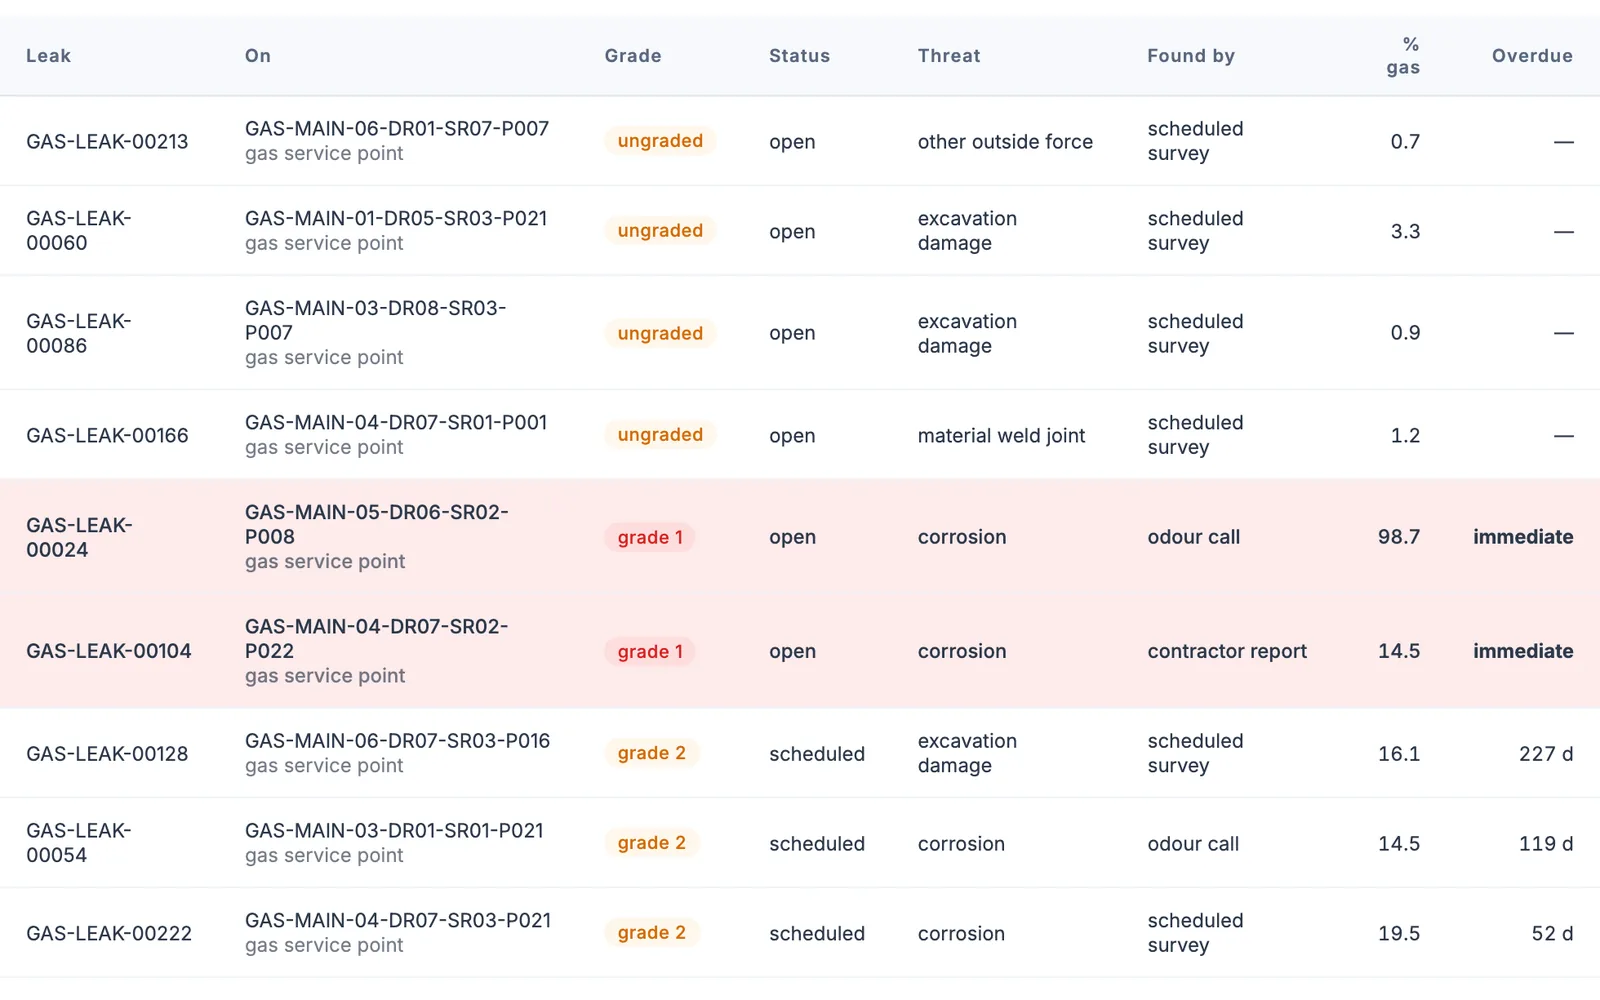
The gas leak register. Every leak graded, with its threat, how it was found, and what is overdue.
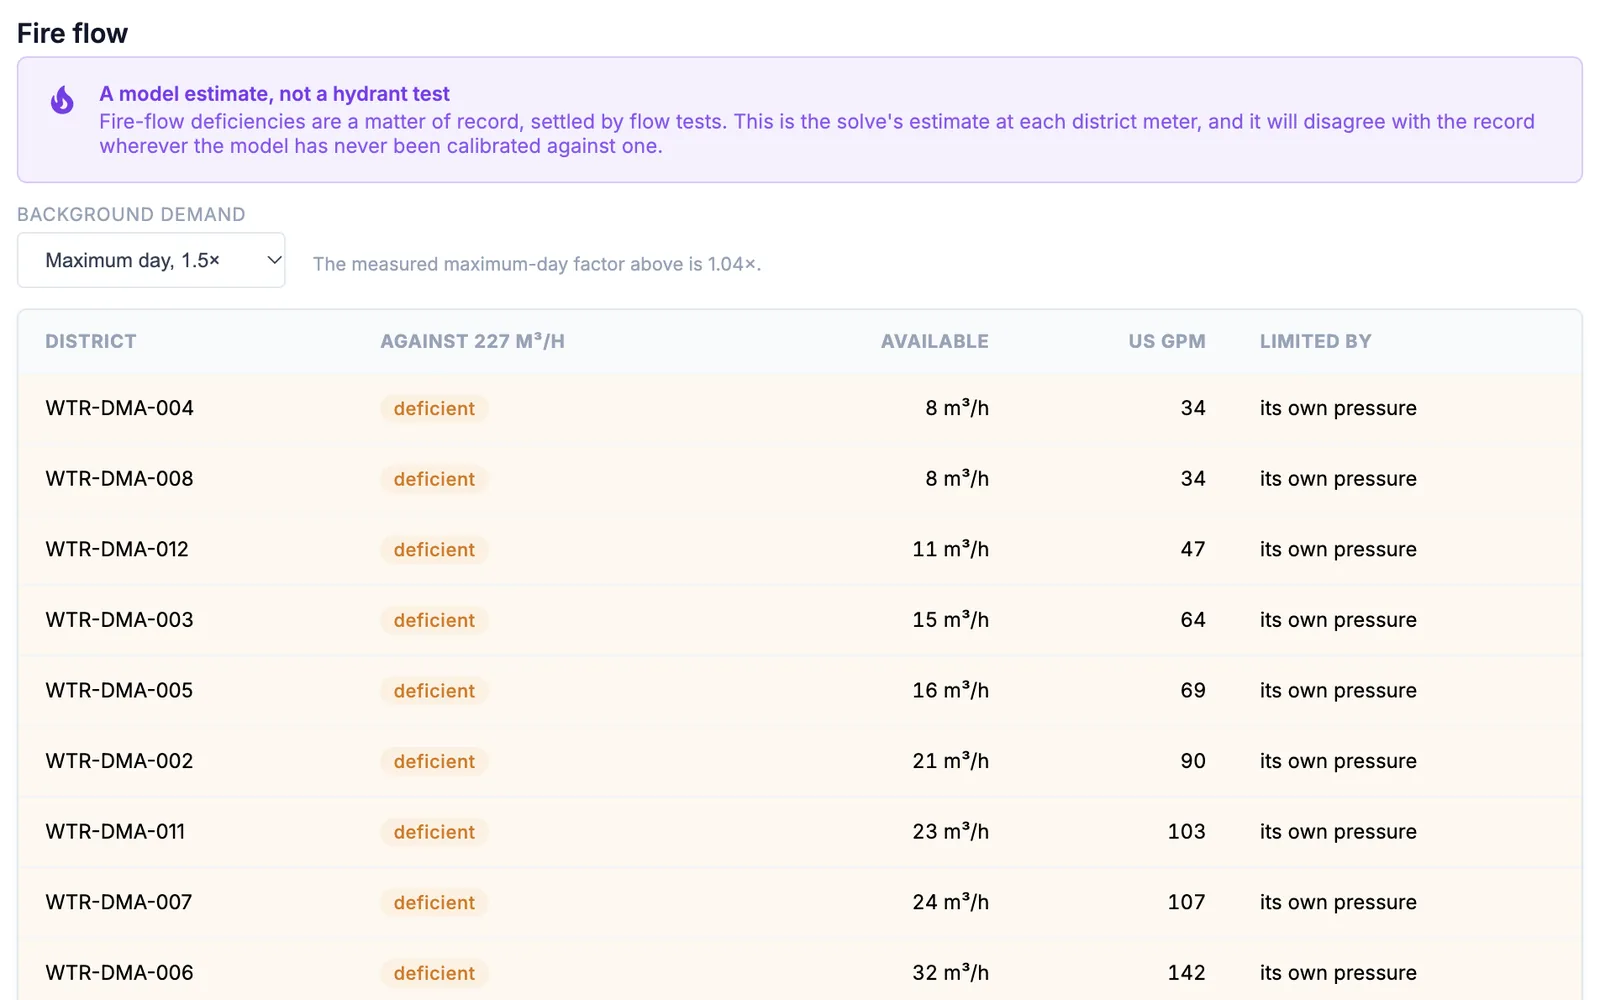
Water fire flow. What each district can draw, labeled as a model estimate — never passed off as a hydrant test.
Use cases
One live map of what the network is and what is happening to it, right now.
Fault locations from two independent methods shorten patrols and restoration.
IEEE 1366 indices computed from source data, defensible in front of a regulator.
EV detection finds the chargers already on the network; capacity headroom, CVR analysis, and the scenario sandbox show where the next EV fleet or solar farm can connect — and what to build if it cannot.
Failure risk, thermal aging, and ranked project planning turn replacement budgets into defensible lists.
Model analysis turns the GIS clean-up backlog into a ranked worklist.
Triage the request queue with honest totals, test feasibility at every ramp step, and compare the connection options on one scale.
Unaccounted-for gas and its trend, regulator droop and lock-up, the graded leak register, a pipe-replacement case built from material, vintage and emissions, and design-day headroom that shows which main to reinforce first.
Night flow and its trend show where leakage recovery pays back first; bursts, PRV and pump performance show where control is slipping; fire flow and pipe criticality show where the network is weakest.
Every family application shares one identity platform, one design system, one registration pattern, and one deployment path.
FAQ
Grid Data Enhanced Analytics (GDEA) joins the connectivity model from your GIS with real-time SCADA telemetry and AMI meter reads and events, and serves one live operational picture of electric, gas and water networks, with power-flow and hydraulic solvers and a library of analysis checks on top.
The network model comes from your GIS. GDEA speaks DNP3 and IEC-104 to the SCADA estate, and AMI reads and events arrive already validated from the Grid Data Management Platform.
No. GDEA is monitoring-only by architecture: it takes SCADA data one way, inward, and there is no command path to the field. That makes it safe to open to every desk in the utility.
It computes SAIDI, SAIFI, CAIDI, MAIFI and CEMI to IEEE 1366 from the utility's own event history, and locates faults two independent ways: from measured fault current and from which meters went dark.
It keeps the large-load queue as a register, flags likely duplicate requests and shows honest gross and net totals, checks feasibility at every ramp step, and compares connection options on one scale.
Yes. The scenario sandbox lets you reconductor a feeder, replace a main or re-set a city gate. The base case and the scenario are compared side by side, so the difference is the change itself, and candidate projects are ranked against the constraints the analytics found.
Yes. A scan runs the Home Energy Management platform's EV detector across every meter on the network. Each result is set beside the utility's own EV record: chargers detected but not on record, and chargers on record but not seen. GDEA reports the difference and never changes the utility's records.
Yes. It sets the utility's service orders beside what GDEA found, so supervisors see the work open on each asset and the findings that still need attention. GDEA can request an order, but the utility's own system always decides and dispatches the work.
For gas: unaccounted-for gas and whether it is growing, regulator droop and lock-up, odorant intensity, a graded leak register, a pipe inventory by material and vintage, methane emissions, and a design-day demand model that shows which main runs out of headroom first. For water: night flow and leakage trends, bursts, pressure-reducing valve and pump performance, reservoir residence, estimated water age and chlorine, turbidity, peaking factors, a demand forecast, fire flow, and pipe criticality. All of it uses data GDEA already holds.
Further reading
The problems behind each capability, written for the engineers and managers who live with them.
Electric
Fault location from fault current and from the meters that went dark.
Read the paperElectric
Honest queue totals, feasibility at every ramp step, and connection options compared.
Read the paperElectric
Finding home EV charging in the meter data you already hold.
Read the paperPlatform
Why analytics that cannot command the field can serve every desk.
Read the paperPlatform
Why analytics should say what they could not see.
Read the paperGas & water
Unaccounted-for gas, overdue leaks, bursts, and leaking water districts.
Read the paperGas
Design-day demand, and which main runs out of headroom first.
Read the paperGas
The pipe inventory, its contradictions, and its emissions, from your own records.
Read the paperWater
Residence time, water age and chlorine, estimated from the network.
Read the paperWater
Peaking, tomorrow’s demand, fire flow, and the mains that matter most.
Read the paperA working demonstration takes thirty minutes — on our environment or yours, with realistic simulated data.
Connect With Us